Many tools rely on summary metadata using Packet Headers, Netflow, Syslog and SNMP to generate security, application and network performance events. The metadata is useful in alerting that an event has happened but it does not give the detailed evidence that allows analysts to move from a suspicion that an event is serious, to certainty of the severity and what remediation effort is required. Having access to packet level data provides that crucial evidence.
To create a simple analogy, full packet capture can be seen as a CCTV system for your network whereas metadata is akin to sensors such as a burglar alarm. Most businesses invest in CCTV and alarms systems for security. In the event of a window being broken or movement in the offices, the sensor triggers an alarm that your business has potentially been compromised which normally leads to a police response. The alarm provides information that your business may have been breached but it is only when the CCTV is examined for the time and sensor location that you can see whether you had a criminal attempting to enter your premises or a stray cat wandering through your offices. If a break-in has occurred the CCTV provides evidence of how your security was breached, how goods were taken from the premises and how much was stolen, and can ultimately be used to identify the perpetrator for future prosecution. The CCTV system that is recording 100% of the time provides the all-important context to the event.
Full packet capture on a network is as critical as having CCTV protecting your premises. Full packet capture runs 100% of the time, recording all traffic traversing your network. If an alert is generated from a SIEM, NPM or APM tool, having the raw packet information is critical to analysing the event and getting to the root cause of the problem.
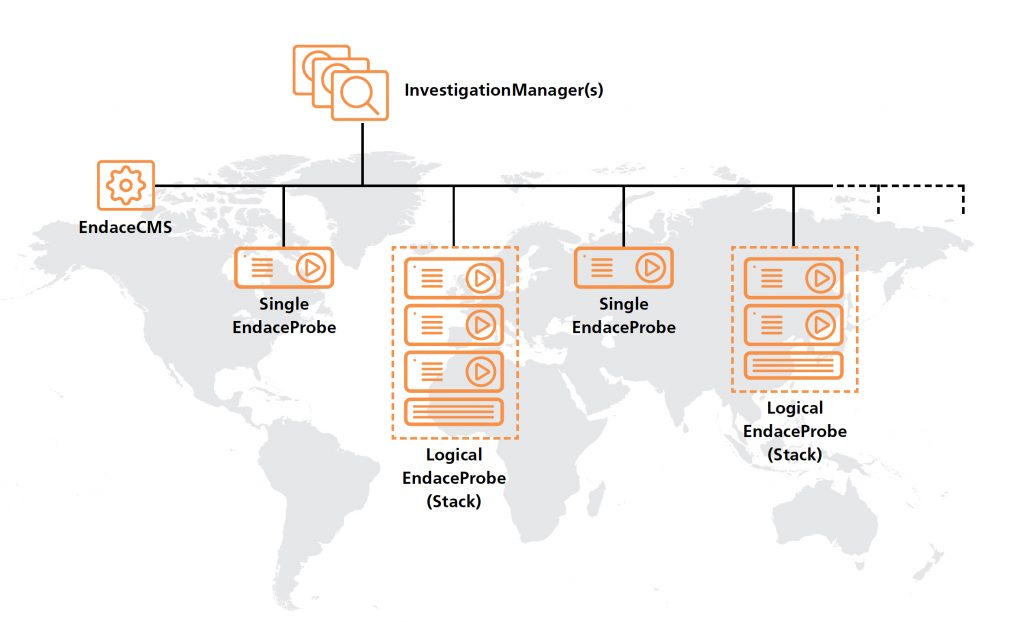
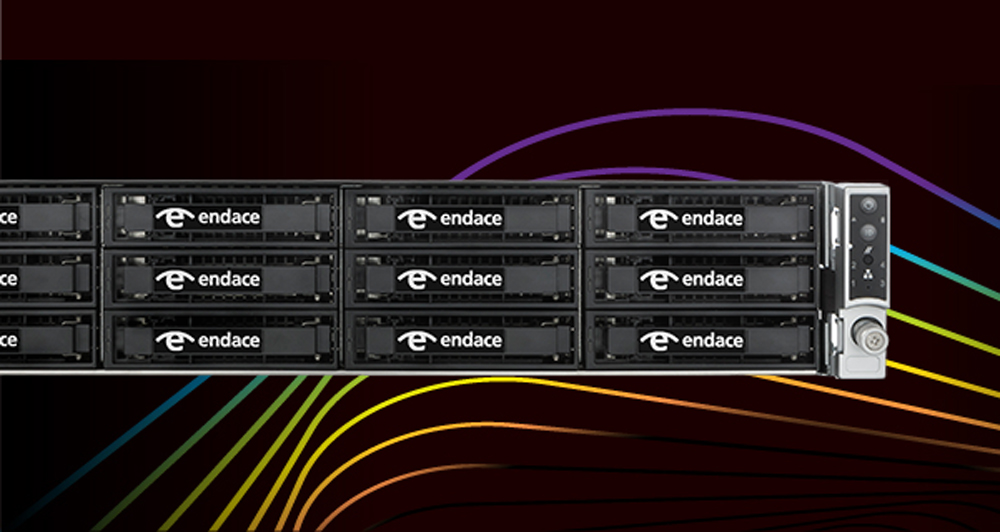
Endace packet capture probes provide raw packet data that offers context when troubleshooting the most difficult problems. Endace records network traffic at high speeds, indexing each packet captured and providing a high-resolution timestamp. Indexing each packet provides a rapid search capability especially when doing a ‘needle in the haystack’ search across billion of packets. Endace’s Investigation Manager enables you to visualize the packet data and perform rapid search operations across petabytes of data stored on multiple probes but viewed and managed as a single packet capture fabric. This probe fabric can span across multiple sites and geographies.

Endace integrates with a range of SIEM, APM and NPM tools via a simple open API that allows operations staff to start investigating an event in their system and then pivot automatically to the Endace UI with all the event parameters prepopulated in Investigation Manager. Because the Endace probes have large storage capabilities, the operations staff can examine historical traffic before the event was triggered to see other suspicious activity that might have preceded the alarm.
The Endace Probe has an open architecture that features Application Dock that allows you to host 3rd party analytics tools on the probes. These tools can be commercial, open source or built in-house and traffic is fed into these tools at line rate for analysis. This ensures that packets are captured to disk and are simultaneously analysed at the same time by your choice of analytics.
If you would like to find out more about how EndaceProbes help tackle your difficult network, application or security problems, you can get in touch with your regional sales representative at Endace via Info-Stor.


